Charlie Walker, Finance Director / Digital Marketer
About This Class

What knowledge & tools are required?
- Microsoft Power BI Desktop is only available for Windows at the current time, so you must have windows
- It is preferred to at least be familiar with creating Excel formulas
What’s this course about?
Microsoft PowerBI is Microsoft’s new business intelligence tool. I will guide you from downloading and installing Microsoft Power BI Desktop to creating reports and dashboards with a sample data set.
We will waste no time! We will get to the end product within the first 30 minutes of the course.
THEN, we will slow things down, and explain some of the intricacies of the software and learn some advanced topics of Microsoft Power Bi.
- Do you want more from Microsoft Excel?
- Would you love to be able to play with massive of data sets with ease?
- Do you run massive files that “spin” and churn in excel when doing calculations?
- Do you want to learn Data Analysis and Data Visualization?
- Do you want to learn about DAX (Data Analysis Expression), the powerful data analysis language which is a HUGE hot career topic?
- Do you want a course that teaches you everything you need to know to get started, but doesn’t waste your time with things you will likely never encounter?
This course is the perfect course for someone who wants to get their feet wet, learn some advanced functions, and take their Data Analysis to the next level with Microsoft Power BI.
Class Projects
Project Description
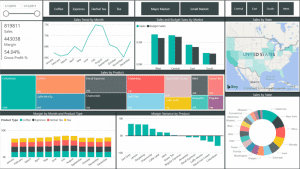
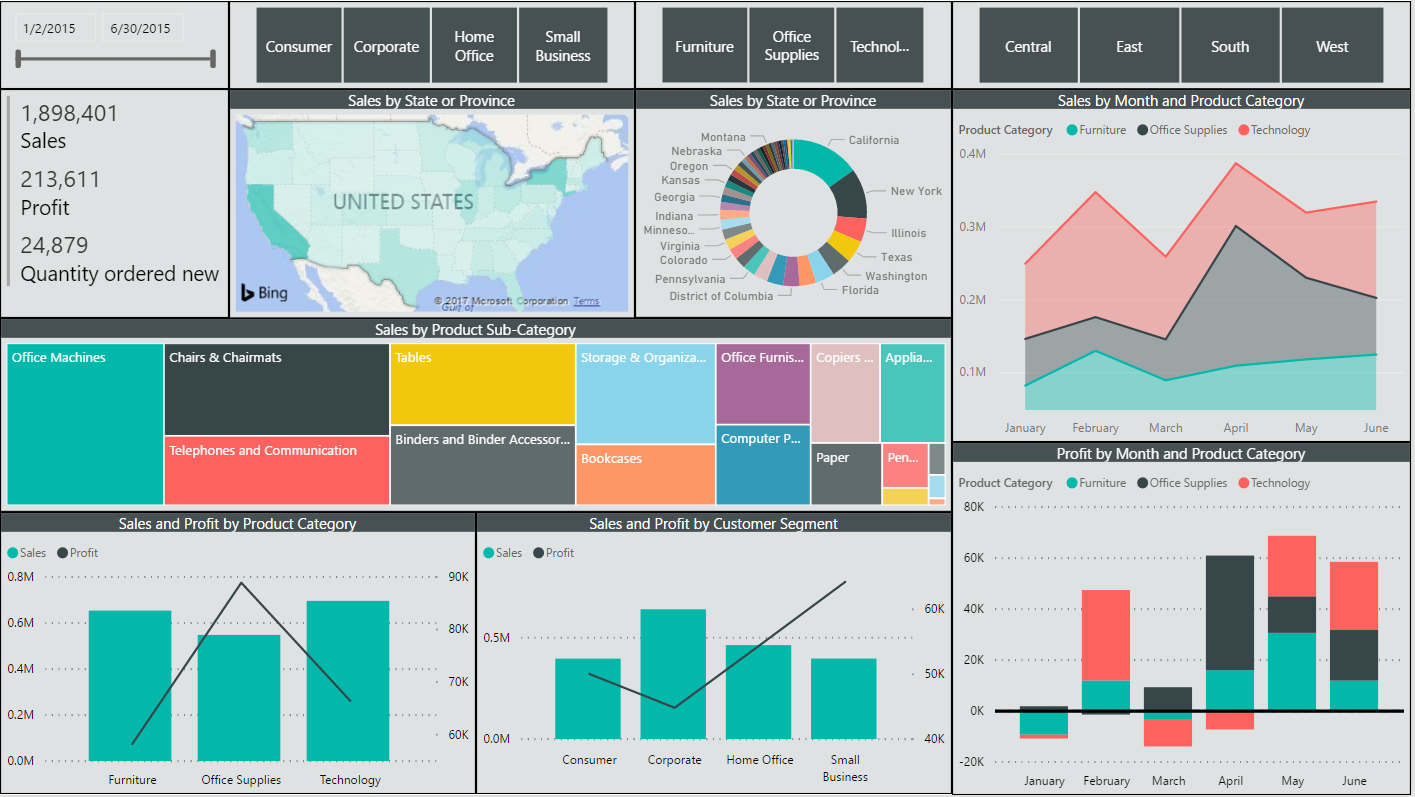
We will go step by step in creating a dashboard from uploading the data set, creating the visualizations, applying advanced DAX queries on the data set, and finalizing and formatting the data.
Then, students are given an additional data set and an objective:
Create a sales and profitability dashboard for the Starbucks CFO. Publish a picture of the dashboad and get custom feedback from me on best practices and how you could improve.
About Instructor
Charlie Walker
Finance Director / Digital Marketer
I started my career at KPMG and then E&Y in accounting, but fell in love with doing financial analysis, analytics, and forecasting.
I’m now a Finance Director where I perform data analysis, data visualizations, and analytics to find hidden trends and insights in data to support business decisions.
Skills in this Class:
Business Data Visualization Finance Excel Analytics Data Analysis Business Analytics Power BI
Size: 1.11GB

https://www.skillshare.com/classes/Microsoft-Power-BI-Complete-Beginners-Guide-to-Financial-Dashboards/1162665939